
Part 1 | Mapping smarter: how to make your entry count

Learn how to add your infrastructure to the Mapping the Arts and Humanities platform. This tutorial covers signing up, writing a strong description, using tags, and making your entry visible and impactful.
Mapping the Arts and Humanities is much more than a directory. It is the first ever national-scale map of research infrastructure in the UK Arts and Humanities sector.
Each infrastructure record you complete can shape perceptions of the field, strengthen support for the Arts and Humanities through more targeted investment and collaboration, and play a part in how future partnerships form.
In this post, and in the accompanying video tutorial, we walk you through how to sign up, add your infrastructure, and make the most of your entry. This guide focuses on the how. Future posts in the series will dive into the why, breaking down the ways each field contributes to the bigger picture and what we can learn from the data itself.
Why it’s worth taking the time
Every field you fill out helps us tell a larger story about the Arts and Humanities in the UK. We’re specifically asking:
- Who’s building infrastructure?
- What kind of subjects are infrastructures engaging with?
- How is it funded and sustained?
- Where are the gaps?
- Where is innovation happening?
Unlike funding data for individual projects, which is often well tracked through platforms like UKRI’s Getaway to Research, there’s no centralised body collecting information about collaborative research infrastructure itself.
You are the expert on your infrastructure. And your entry gives visibility and weight to work that’s often overlooked in traditional reporting.
Adding your infrastructure doesn’t just help others find you, it ensures your record reflects your work accurately and in full. Because in the end, the map only works if it reflects the full picture of deeply-knotted connections – and you’re part of that picture.
What this tutorial covers
In this blog post and in the video tutorial, we will walk you through:
✅ How to sign up
✅ How to write a strong description
✅ Why subject tags and keywords matter
✅ How your infrastructure appears in our relationship and map visualisations
The video is fully guided and segmented, so you can pause and follow along at your own pace or skip to the section that’s most relevant to you.
What happens after you submit?
Once your infrastructure is added to the site, it becomes:
📍Searchable by subject, region, and type
📍Visible to policymakers, funders, and fellow researchers
📍Connected through networks of collaboration
📍Counted in sector-wide analysis and advocacy work
You’ll also be able to manage your own record, or invite team members to help, and update your information any time.
Getting started: how to add your infrastructure to the Mapping the Arts and Humanities Website
🧭 Step 1: Signing Up
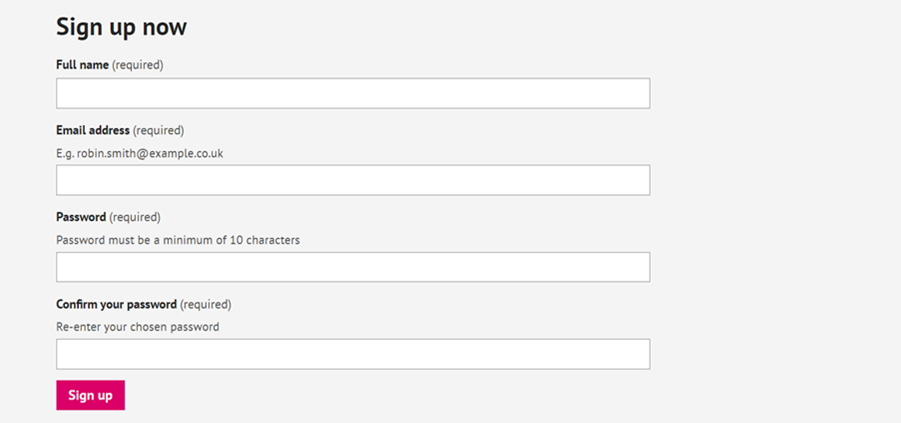
You’ll start on the homepage, where you’ll find the Get Involved button.
From there, you’ll be taken to a quick sign-up form. You can either sign up:
- As yourself (good if your infrastructure doesn’t have a shared inbox; ensures you receive important updates)
- On behalf of your infrastructure (keeps the record consistent if team members change; ideal for long-term management)
You can always add collaborators later, too, so whichever option works best for now is fine.
Once you sign up, check your inbox for a verification email (don’t forget to check spam!).
📁 Step 2: Adding Your Infrastructure
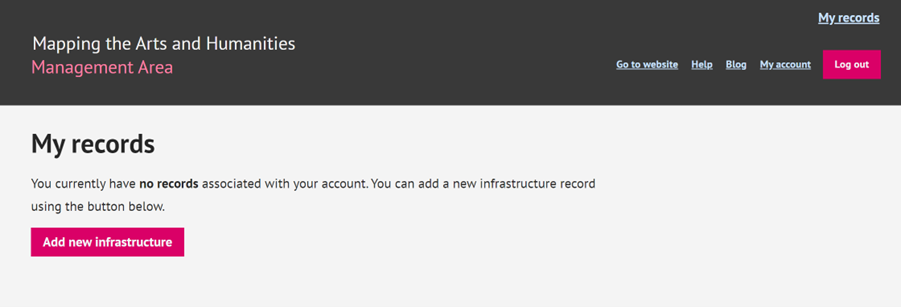
Once logged in, head to the management area. If you’ve been invited to manage an existing record, you’ll see a notification – just accept it, and you’re in!
Otherwise, click Add new infrastructure to create your own record.
📄 Filling Out the Form
Below you will find a quick overview of what each section of the form does and why it is important that they are appropriately filled out.
🧱 Essential information
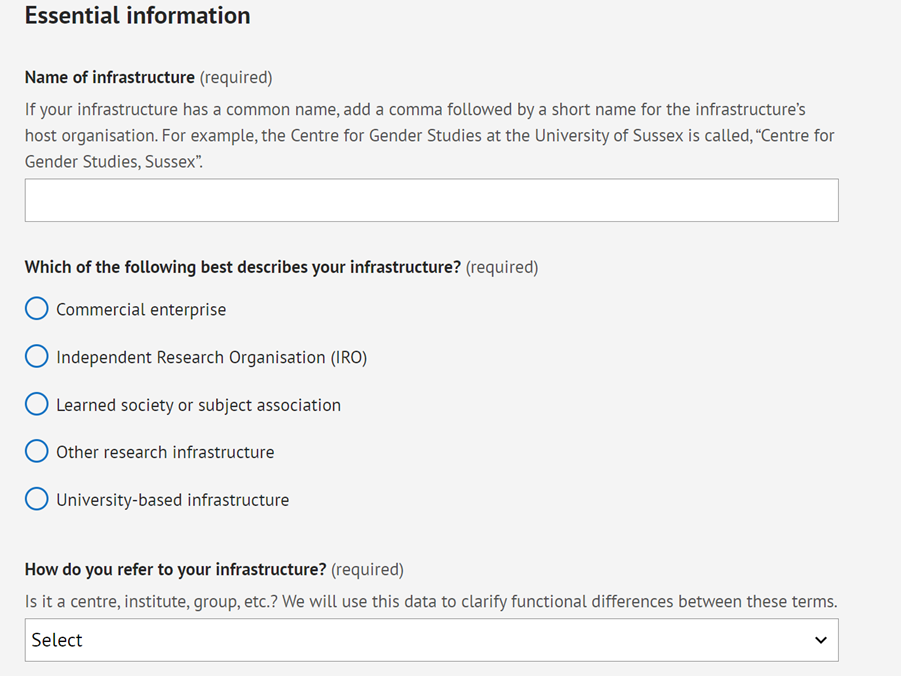
Start with your infrastructure’s name, type, and how it refers to itself (centre, hub, group, etc.)
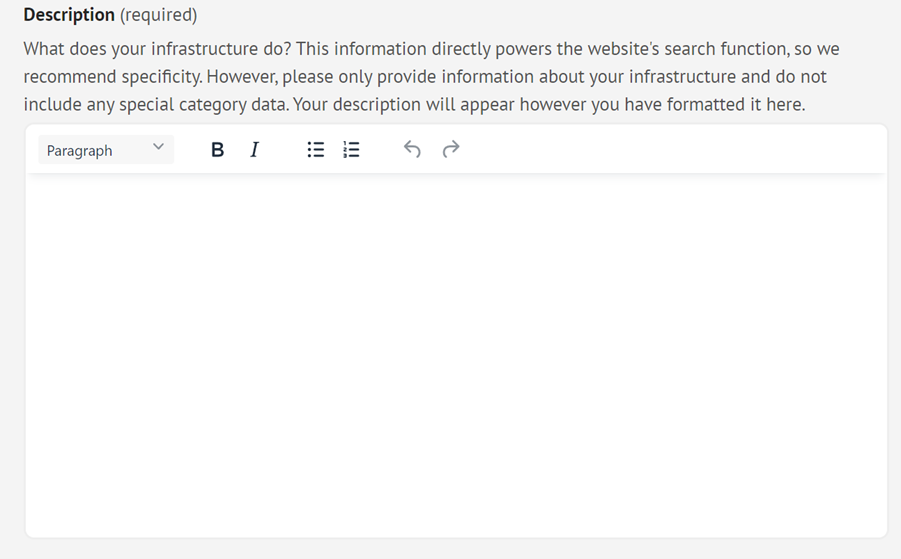
The description field is especially important – it powers the website’s search function and helps users better understand your work. This is a great opportunity for you to reflect on the projects, values, research areas, and scope that define your infrastructure. This is the qualitative layer of the dataset, the part that lets you tell the story of your infrastructure in your own words.
Be specific! Think about what sets your infrastructure apart, what questions it’s asking, what communities it serves, what kinds of methods or publics it engages. The more texture and detail you can provide, the better we can represent your work and advocate for the Arts and Humanities sector as a whole.
⭐Tip: Want to include a hyperlink (like your LinkedIn and BlueSky accounts)? Just format it in Word or another text editor using Ctrl+K (or Cmd+K), then copy it into the description field.
🖥️Stay tuned: in future blog posts, we’ll look at how this narrative data can be explored using natural language processing, semantic clustering, and other text-based methods. From identifying recurring patterns of language to surfacing conceptual connections across fields, the description field helps us analyse the language that research infrastructures employ, the question of disciplinary definitions, and the blurring of boundaries that have traditionally structured how we classify knowledge.
🧾 Additional information
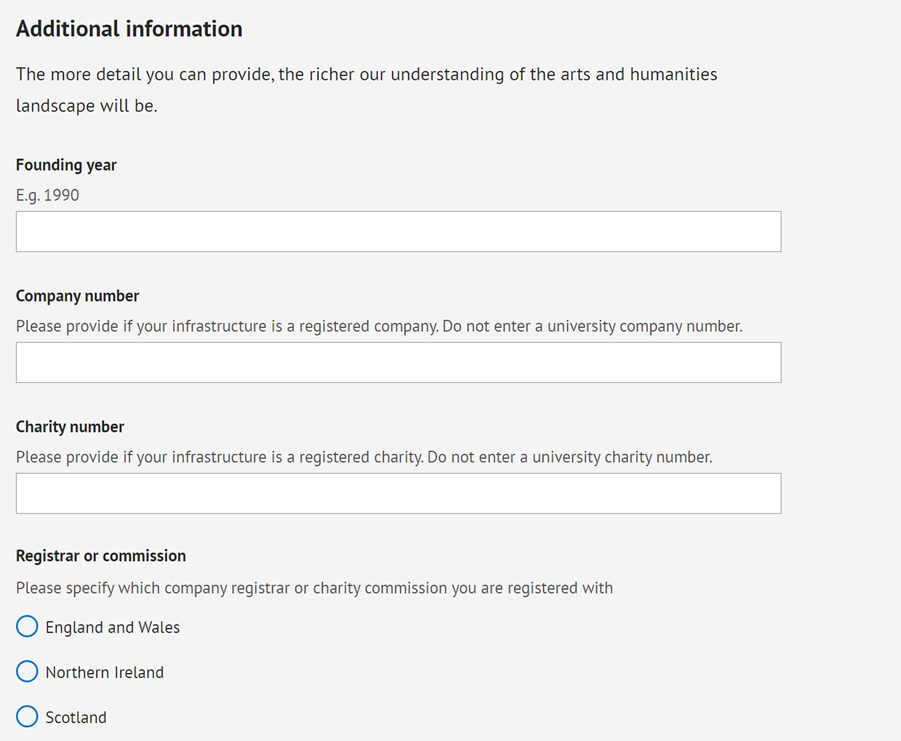
Optional, but helpful! Fields like founding year let us trace when infrastructure emerge – useful in spotting historical trends and periods of growth across the sector. It’s valuable for visualising the development of research capacity over time. In conversation with the tags, founding year data can also help us suggest thematic trends. For example, whether particular research areas gained traction in a given year or whether infrastructures emerged in response to specific priorities or events.
Registration numbers (such as company or charity numbers) might feel like admin, but they allow us to link your record to external open datasets, which can support things like funding analysis, governance mapping, and sector-wide comparisons.
🔍 If your infrastructure doesn’t have its own registration number, please don’t use your university’s. These are often tied to large umbrella entities with thousands of activities, which can distort the dataset and obscure the specific profile of your infrastructure.
📬 Contact Details

Here you can add your mailing address. If it isn’t found in the dropdown, don’t worry – you can manually add coordinates using Google Maps further down in the form.
If you don’t have a fixed location, you can still be represented on the map using relationships and tags.
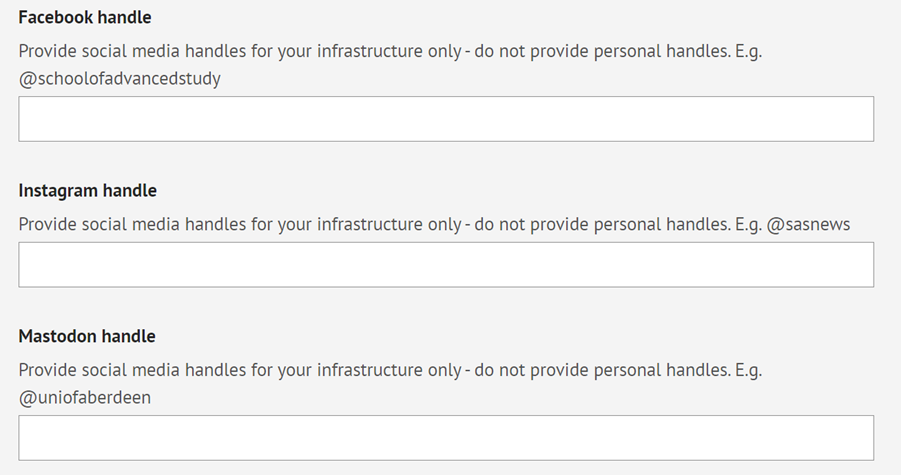
You can also add a website, email (we recommend an institutional one if you have it), and any relevant social media handles.
🧭 Map Display
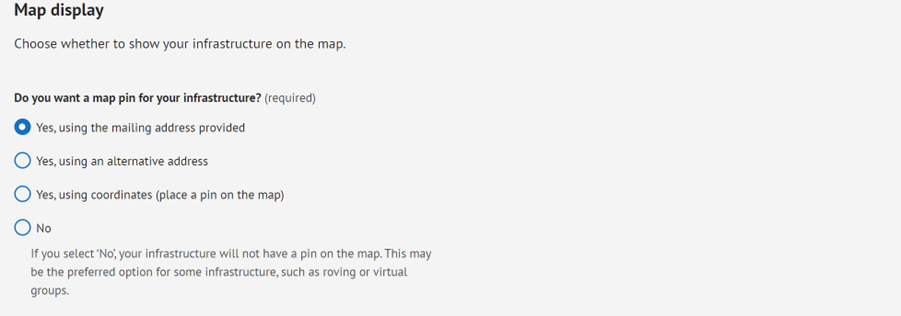
Choose how you want your infrastructure to appear on the map. You can:
- Use your mailing address
- Use alternative coordinates
- Opt out of a map pin (ideal for virtual infrastructures)
We love the map view — it helps people discover what’s near them and understand how the sector connects.
🏷 Subject Tags and Keywords
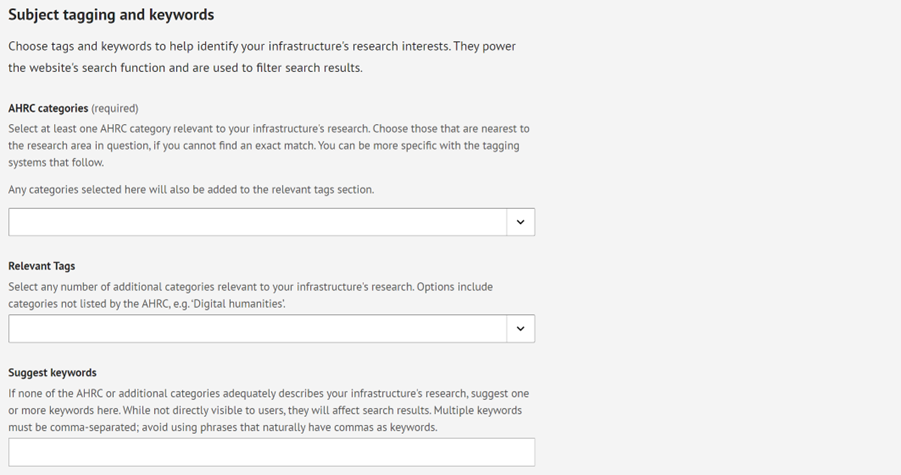
Our favourite part! Tags help surface your infrastructure in search results. There are:
- AHRC categories (set taxonomy)
- Relevant tags (more flexible)
- Suggested keywords (totally up to you!)
Include anything that reflects the full scope of your work; not just your core focus (represented by the AHRC categories), but also tags to identify side projects, collaborators’ areas of expertise, or emerging interests. It all counts.
Every tag you add adds texture to your record while also giving others a better way to find and understand your work.
We’ll be digging into this field in an upcoming blog post, looking at how tags can reveal patterns, gaps, and unexpected connections across the sector.
But for now, it’s worth remembering that tagging is key to surfacing the full range of your infrastructure’s interests – and it’s worth filling it out with corresponding care. The more intentional you are, the more visible, searchable, and connected your record becomes.
💸 Funding Information

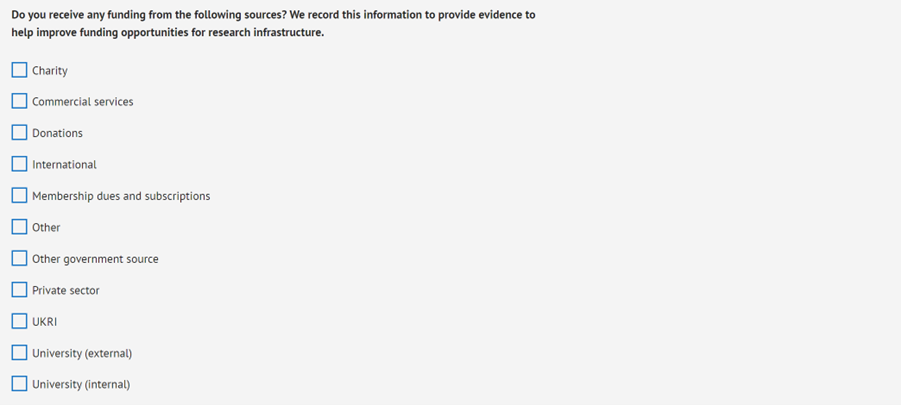
Two quick questions, but one’s with long-lasting impact:
- What kinds of funding opportunities does your infrastructure offer?
(e.g. bursaries, internships, fellowships, prizes) - Where does your funding come from?
(e.g. internal, international, UKRI, charity, commercial services, membership fees)
This information helps us advocate for stronger, more sustainable support for collaborative research infrastructures across the sector. While projects are often funded and visible, the infrastructure behind them is not always tracked. This field helps change that.
Over time, this data will also be able to support funding landscape analysis: spotting trends in where money flows (or doesn’t), which types of infrastructures tend to be self-funded, and what opportunities are available to researchers across different disciplines and career stages.
Even ticking a few boxes here aids in building a clearer, more evidence-based picture of how infrastructures operate and where future investment is needed.
🧩 Relationships with Other Infrastructure
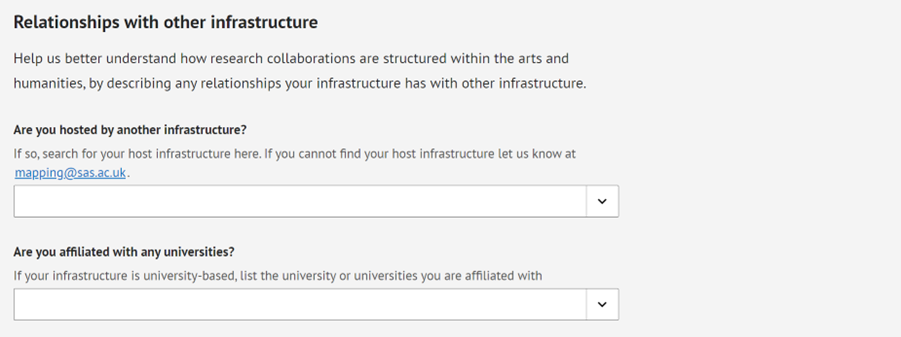
This section is meant to provide insight into how research infrastructures interact, support one another, and exist in context. It’s about the web of relationships that often go unrecorded.
We ask:
- Are you hosted by another infrastructure?
- Are you affiliated with a university?
- Who do you collaborate with – other infrastructures, universities, organisations?
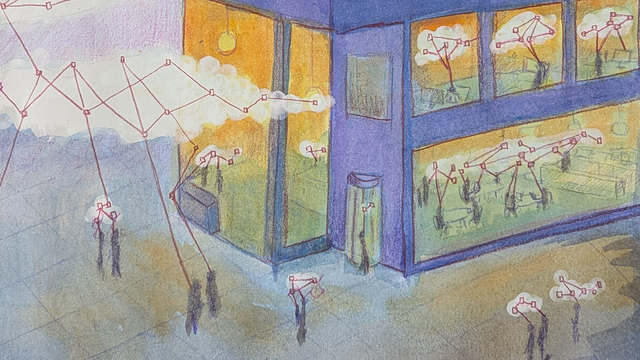
These relationships help power our visualisation tools, including the dashboard’s relationship graphs, with a view to identify collaboration patterns, reveal disciplinary silos or bridges, and show the sector’s often invisible research ecosystem.
Whether it’s a small hub working with a national library, or a university centre that works with a local heritage archive or is doing advocacy work through councils, these connections speak to the Arts and Humanities sector as interdependent and often rooted in public life: benefiting communities, driving cultural and civic impact, and providing economic and societal value.
👥 Record Ownership
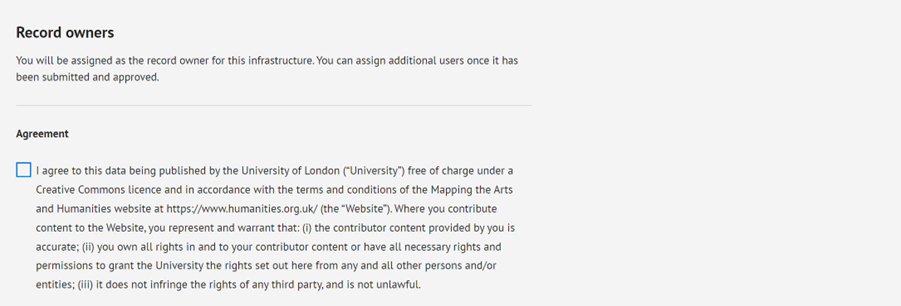
Once submitted, you’ll be listed as the record owner. You can always add other people later on.
Just tick the agreement box, review the terms, and that’s it — your infrastructure is officially part of the map.
Mapping smarter, together
And that’s a wrap! Thank you for taking the time to read this tutorial. We’re excited to welcome you to the platform.
We know filling out forms isn’t always fun. But we believe this one is different.
This is for your peers, your community, your future collaborators. It’s a tool for telling the evolving story of the Arts and Humanities sector, and it only works because of the people who take the time to add their voices.
Thank you for being one of them.
📩 Questions? Want to suggest a tutorial? Reach us anytime at [email protected]
📺 Watch the full tutorial video here.
🗺️ Explore the live map here
➡️Next up: More than just a label: the “name of infrastructure” field

RESHAPED: Building Infrastructure for Humanities Training
In this companion piece to the Mapping the Arts and Humanities Podcast, Niilante Ogunsola-Ribeiro and Simon Parr explore how RESHAPED, a free peer-reviewed training platform hosted at the School of Advanced Study (SAS), University of London is building connected learning pathways across the humanities.
In Development: Mapping the Humanities and AI
Humanities scholars across the UK are shaping critical thinking and practical action around AI. But the work is scattered across institutions and websites, which is making connections harder to spot. Mapping the Humanities and AI is a map in development that will visualise this activity, highlight networks and gaps, and support collaboration across research, policy, and practice.

Knowledge Diplomacy in Context: British Council, A Legacy of Building Connections
Michael Peak joins us for the "Knowledge Diplomacy in Context" series, which spotlights real-world...

Mapping Openness and AI: Insights from the AI and Openness Workshop for the Arts and Humanities (Part 1)
Sinem Görücü / Silicon Landscapes / Licenced by CC-BY 4.0Following the “AI and Openness” workshop,...

Knowledge Diplomacy in Context
International collaboration strengthens global ties, but the vital infrastructure behind it often...

UK DARIAH Day 2025: Imagining Future Digital Research Infrastructures
As the landscape of arts and humanities research becomes increasingly digitised, the necessity for...

Law and the Humanities in Practice: Voices from the Sector
Across universities and cultural institutions, there is a growing recognition that the discipline...

Introducing the Knowledge Diplomacy Mapping Initiative
The Knowledge Diplomacy Mapping Initiative (KDMI), a new collaboration from the Knowledge...

Law and the Humanities: A Disciplinary Cartography
James Campbell (Centre for Socio-Legal Studies, Oxford) joins us on the Mapping the Arts and...

Mapping Knowledge, Building Trust: A New Phase for the Knowledge Diplomacy Project
Dr Monja Stahlberger discusses the Knowledge Diplomacy Project's new phase, launching an...